NSW feed year growth rate patterns
New South Wales – Feed year growth rate patterns
Source: NSW PROGRAZE Manual, Appendix 4, NSW Agriculture (for further information and assumptions on which these tables are based, see NSW PROGRAZE Manual or visit the Department’s website, www.agric.nsw.gov.au).
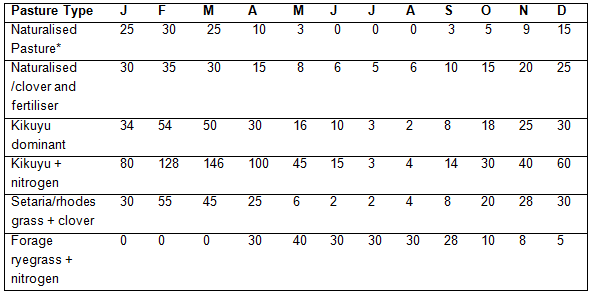
Northern Tablelands
Estimated daily pasture growth rate (mid-month) of specific pasture types (kg DM/ha/day)

*Quality of red grass (with low leaf to stem ratio and rapid maturity) may not be adequate to meet livestock production targets.
The predicted growth rate could vary markedly between good and poor growing seasons.
|
|
Good growing season |
Poor growing season |
|
Spring |
30% above |
40% below |
|
Summer |
30% above |
40% below |
|
Autumn |
75%+ above |
60%+ below |
|
Winter |
30% above |
40% below |
Central Tablelands
Estimated daily pasture growth rate (mid-month) of specific pasture types (kg DM/ha/day)
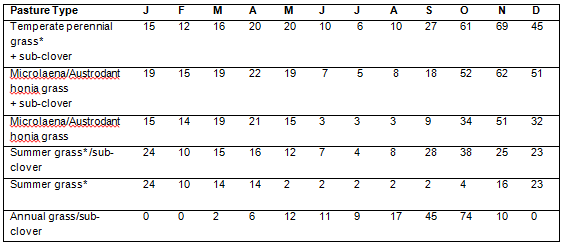
*Phalaris, cocksfoot, fescue or perennial ryegrass based with at least 20% clover.
#Mainly frost sensitive grasses such as red grass.
The predicted growth rate could vary markedly between good and poor growing seasons.
|
|
Good growing season |
Poor growing season |
|
Spring |
50% above |
40% below |
|
Summer |
100%+ above |
70% below |
|
Autumn |
65% above |
60%+ below |
|
Winter |
40% above |
60%+ below |
Southern Tablelands and Monaro
Estimate daily pasture growth rate (mid-month) of specific pasture types (kg DM/ha/day)
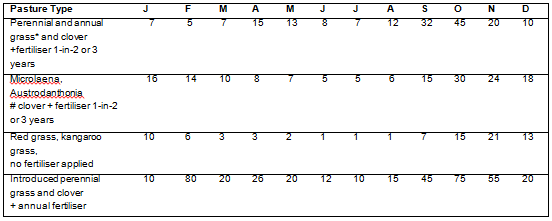
* Established perennial pasture (30% introduced grass, ie phalaris, 20% annual clover and 20% annual grass).
# Microlaena and austrodanthonia grass 50–60% pasture, 25–30% clover and 10-20% annual grass.
The predicted growth rate could vary markedly between good and poor growing seasons.
|
|
Good growing season |
Poor growing season |
|
Spring |
50% above |
40% below |
|
Summer |
50% above |
40% below |
|
Autumn |
50% above |
30% below |
|
Winter |
80% above |
60% below |
North West Slopes and Upper Hunter
Estimated daily pasture growth rate (mid-month) of specific pasture types (kg DM/ha/day)
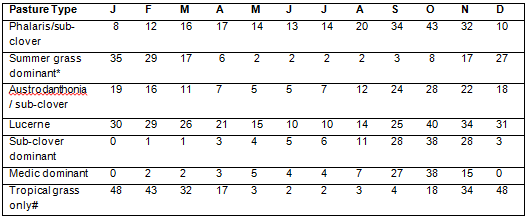
*Mainly frost sensitive grasses such as red grass.
#Mix of bambatsi panic and purple pigeon grass with less than 5% sub clover or medic.
The predicted growth rate could very markedly between good and poor growing seasons.
|
|
Good growing season |
Poor growing season |
|
Spring |
50% above |
50% below |
|
Summer |
100% above |
50% below |
|
Autumn |
100% above |
60% below |
|
Winter |
30% above |
50% below |
Central West Slopes
Estimated daily pasture growth rate (mid-month) of specific pasture types (kg DM/ha/day)
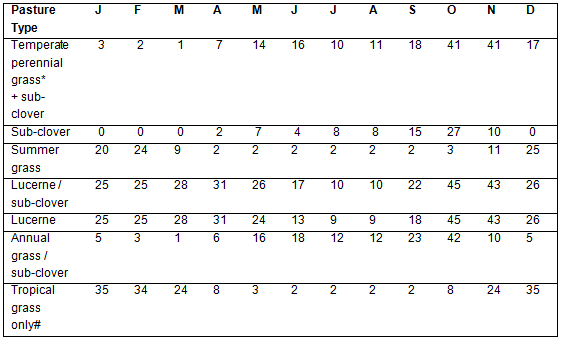
*Phalaris, cocksfoot, fescue or perennial ryegrass based with at least 20% clover.
#Mix of bambatsi panic and purple pigeon grass with less than 5% sub clover or medic.
The predicted growth rate could very markedly between good and poor growing seasons.
|
|
Good growing season |
Poor growing season |
|
Spring |
70% above |
80% below |
|
Summer |
100%+ above |
80% below |
|
Autumn |
100%+ above |
60%+ below |
|
Winter |
70% above |
60% below |
South West Slopes
Estimated daily pasture growth rate (mid-month) of specific pasture types (kg DM/ha/day)
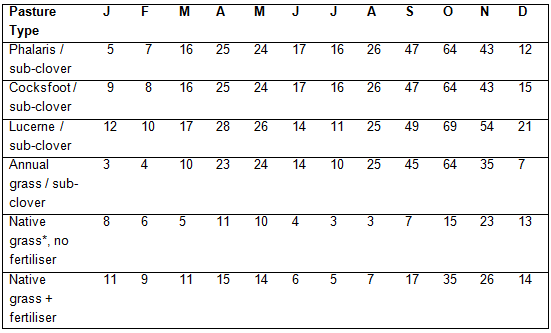
*Quality of red grass (with low leaf to stem ratio and rapid maturity) may not be adequate to meet livestock production targets.
The predicted growth rate could very markedly between good and poor growing seasons.
|
|
Good growing season |
Poor growing season |
|
Spring |
30% above |
60% below |
|
Summer |
200% above |
70% below |
|
Autumn |
30% above |
60% below |
|
Winter |
80% above |
20% below |
North Coast
Estimated daily pasture growth rate (mid-month) of specific pasture types (kg DM/ha/day)
*Dominated by carpet grass and with no introduced legumes.
The predicted growth rate could vary markedly between good and poor growing seasons.
|
|
Good growing season |
Poor growing season |
|
Spring |
70% above |
60% below |
|
Summer |
60% above |
60% below |
|
Autumn |
120% above |
90% below |
|
Winter |
150% above |
70% below |
Mid North Coast and Lower Hunter
Estimated daily pasture growth rate (mid-month) of specific pasture types (kg DM/ha/day)
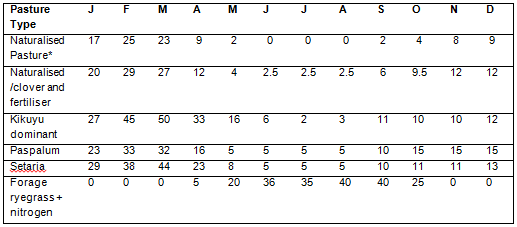
*Dominated by carpet grass and with no introduced legumes.
The predicted growth rate could vary markedly between good and poor growing seasons.
|
|
Good growing season |
Poor growing season |
|
Spring |
145% above |
73% below |
|
Summer |
114% above |
46% below |
|
Autumn |
70% above |
80% below |
|
Winter |
89% above |
67% below |

