2.02 - Assessing groundcover
Groundcover is the amount of plant material (dead or alive) that covers the soil surface. It is expressed as a percentage; 100% groundcover means that the soil cannot be seen and 0% groundcover is bare soil.
Common scenarios that reduce groundcover include overgrazing, times of drought, cropping, tilling, poor seed establishment, chemical removal and excessive traffic.
Managing groundcover can ensure that soils do not become susceptible to degradation caused by erosion from wind and water.
The tools allow you to assess the current groundcover conditions using a range of different techniques.
Monitoring groundcover
The following monitoring tools will provide a range of different monitoring techniques. You can decide to use just one of the tools or both, depending on how you prefer to monitor and how much time you have.
Goal: To maintain groundcover at a minimum of 70% to prevent soil erosion from wind and water, remembering that groundcover includes living and dead plant material and litter.
Tool A: Visual assessment
-
STEP 1: Select areas to monitor
It is important to record the areas monitored, stating specifically where the assessments were taken and, if possible, marking the areas on a farm map. This will allow you to assess groundcover over time.
-
STEP 2: Decide the time of year when groundcover is at its lowest level
Groundcover is seasonally variable, therefore it is important to take into consideration the times of the year that the monitoring has taken place and, in some cases, it may be advantageous to monitor twice a year. In southern Australia, groundcover is often at its lowest level prior to the autumn break, and this is the best time to assess the risk of soil loss through erosion.
-
STEP 3: Choosing a representative area
It is important to make sure that the areas being assessed are representative of the entire area. The best way to achieve this is to walk along an imaginary transect line, diagonally across the paddock from post to post (Figure 1), or take 10 steps in one direction then randomly turn and take 10 steps in another direction (Figure 2).
![]()
Figure 1. Transect
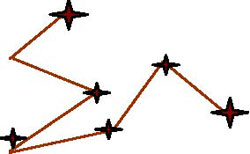
Figure 2. Zig Zag (random)
If an area seems quite uniform, 8-10 assessments will give you a good indication of the average groundcover. In areas of high variability, take at least 15 or more assessments (depending on the size of the paddock or area).
Draw your transect roughly on a piece of paper and note approximately where the assessments were taken. Remember to mark on the drawing where North, or the top of the paddock, is to give you a reference point.
-
STEP 4: Estimate the groundcover
Make a 30 × 30cm quadrat (square) out of sturdy cardboard or wire. A quadrat is used to help focus the eye on a defined area for assessment.
Along the pre-determined transect line (Figure 1 and Figure 2), throw the quadrats out at random and visually assess the groundcover in the quadrant, comparing it with the photo standards. Record the assessments in the pro-forma table provided below.
-
STEP 5: Photographic records
Photographic records can be used in conjunction with the visual assessment as a permanent reminder of what the pasture cover was like when being assessed. It is important to take the photos in the same spot each time and also to ensure that the photos are taken approximately at the same times of the day.
Pro forma sheet for recording groundcover assessments
Open PDF to the pro forma sheet for recording groundcover assessments template
| Assessment location | Date of assessment | Transect type (eg line or random) | Sample number (eg 1, 2, 3) | Percentage groundcover |
| eg Pd 10B | 12/12/11 | line | 1 | 70% |
Pro forma sheet for calculating average groundcover assessments
Averaging the measurements in each area monitored will give you an overall % groundcover figure for that area. These can't be compared to other areas of the farm, and priority can be made to the areas of low groundcover % for on-ground works.
Average percentage of all assessments:
- Add up all the percentages taken in the same area and divide that by the number of assessments taken. Then multiply by 100 to give an average percentage of groundcover for that area.
Example
Add up the five samples taken in paddock 10B: 70% + 90% + 40% + 70% + 40% = 310%
Then divide the total of the samples by the number of samples taken: 310/5 = 62%
Open PDF to print below template: Pro-forma sheet for calculating average groundcover assessments
| Assessment location (Column A) |
List samples taken (%) (Column B) |
Total of samples taken (%) |
No. of samples taken (Column D) |
Average percentage of groundcover (%) |
| eg Pd 10B | 70, 90, 40, 70, 40 | 310 | 5 | (C / D) = E 310/5 = 62% |
Minimum levels for pastures in south-eastern Australia are suggested to be:
- 70% for pastures on flat and slightly sloping (<3%) land and on non-erosion prone soils (moderate-good soils generally). Herbage mass should be a minimum of 800–1,200kg dry matter (DM)/ha.
- 80–90% groundcover for lighter, more erosion prone soils and minimum herbage mass should also be 1,000&ndash:1,500kg DM/ha where land is undulating.
- 90–100% groundcover for steep hill country on light and erosion prone soils (eg slopes of greater than 10%, granite or light sedimentary soils with low fertility and often high acidity). Herbage mass should be a minimum of 1,500kg DM/ha.
- In areas such as the Mallee and Western Australia, 50% is often used as the minimum groundcover percentage.
If you have less than the minimum groundcover percentages at the critical time, then your stocking rate is too high for sustainability.
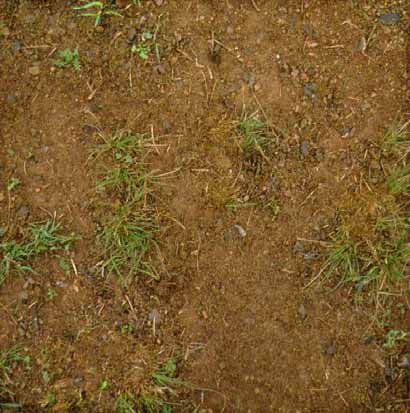
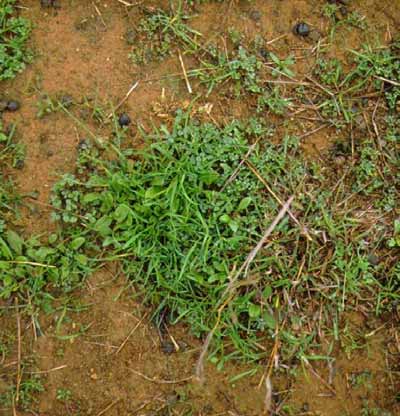
20% cover 40% cover
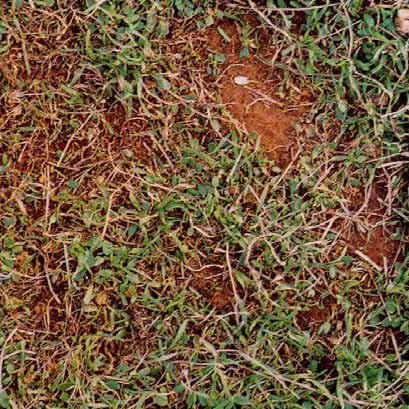
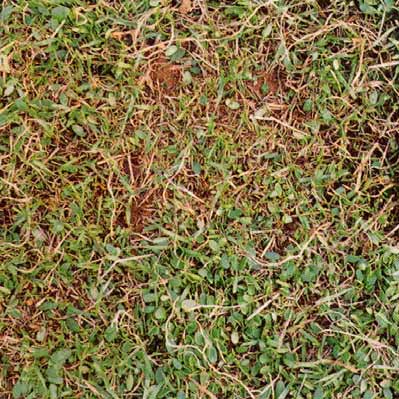
50% cover 80% cover
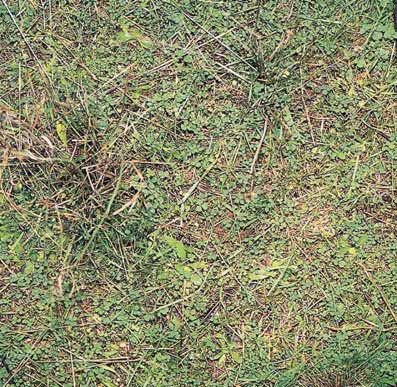
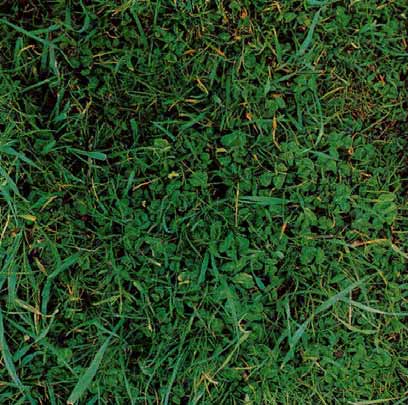
90% cover 100% cover
Tool B: Field assessment - The step point method
-
STEP 1: Select areas to monitor
-
STEP 2: Decide the time of year when groundcover is at its lowest level
The first 2 steps of this method are the same as in the visual assessment method.
-
STEP 3: Choosing a representative area
- Make sure that the areas being assessed are representative of the entire area. For the wire and step point method, it is recommended that you divide the area to be assessed into four line transects (use fences posts or trees to help guide your path along the transect) and sample 25 times at random along the transect.
Figure 3. Transect
-
STEP 4: Estimate the groundcover
Taking the readings:
- Look straight ahead along your transect line, and take a number of steps along the line (depending on how long the line is to how many steps you can take).
- Look down and record the presence (yes) or absence (no) of surface cover directly at the toe of your boot on the pro-forma sheet below.
- After recording the result, repeat steps 1–4 until you have recorded 25 sample points along the transect.
Example: Pro forma sheet for recording groundcover assessments with the step point method
| Location: | Old school paddock | |
| Sampling date: | 12/11/11 | |
| Transect | Surface cover | |
| YES | NO | |
| eg 1 | 13 | 12 |
| eg 2 | 15 | 10 |
| Eg. 3 | 14 | 11 |
| Eg. 4 | 11 | 14 |
| TOTAL YES (A) divided by TOTAL SAMPLES TAKEN – A / (A+B) = D Convert to a percentage – D x 100 = ___% |
||
| TOTAL YES divided by TOTAL SAMPLES TAKEN – 53 / 100 = 0.53 Convert to a percentage – 0.53 x 100 = 53% |
||
| Percentage cover = 53% | ||
Pro forma sheet for recording groundcover assessments with the step point method
Open PDF to print the pro forma sheet for recording groundcover assessments with the step point method
Tool 2.2, Tool B
The step point method
| Location: | ||
|---|---|---|
| Sampling Date: | ||
| Transect | Surface Cover | |
| YES (A) | NO (B) | |
| TOTAL: | ||
|
FORMULA: |
A / (A+B) = C C X 100 = Percentage cover in % |
|
|
TOTAL YES divided by TOTAL SAMPLES TAKEN - |
/ ( + ) = X 100 = % |
|