2.07 - Field based pasture measurements
Pasture mass
Pasture mass can either be assessed by cutting, drying and weighing representative pasture samples or by the use of tools of varying levels of sophistication.
Pasture assessment tools save much time in collection and are considered to be the only practical method for use when day-to-day assessments are being made. Three broad groups of tools are used to measure pasture mass:
- Pasture rulers or ‘sticks’ that measure pasture height are simple, cheap and easy to use. Heights are easily converted to an estimate of kg green DM/ha via lookup tables.
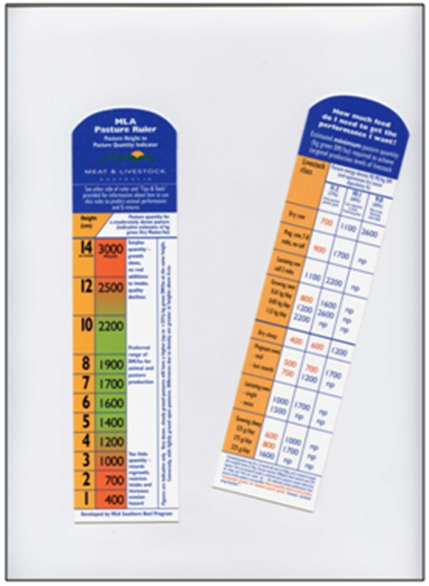
- Figure 1: The MLA Pasture Ruler - order your copy here for free
Also have a look at these handy Tips & Tools to understand how to get most out of the Pasture Ruler.
- Pasture density also needs to be estimated and used as a correction factor when growing or mature pasture is less than 100% of groundcover. See methodology for assessing groundcover and pasture composition below which can be used to estimate the percentage density of pasture.
- The measurements also give a guide to the mass of dry standing feed, but usually underestimate the reading. PROGRAZE® notes describe a method to adjust.
- With experience, you can use the height assessment method to gain reasonably accurate estimates of mass, especially when periodically checked against assessments made by cutting and weighing.
-
Rising plate meters measure total pasture mass, green and dry standing feed, and are based on a plate that rises up a probe depending on the amount of compressed pasture material between the plate and ground.
- Sophisticated models are available that will collect and store field measurements to average readings across a paddock or a number of paddocks
- They are available from a number of commercial outlets and price generally depends on the degree of automation of collection.
- Generally slightly cheaper than electronic probes and may be preferable when frequent automated assessment of pastures with significant levels of non-green pasture is needed.
-
Electronic pasture probes measure dry matter of green material only.
-
They are quick, easy to use and usually fully automated, including the capacity to directly download readings into office computers.
- Some also allow collection of user defined and read assessments such as groundcover or phenology.
- Their accuracy declines if there is any free moisture present in the pasture (eg after rain or heavy dews).
-
These are normally the most expensive of the three groups.
Satellite imaging is currently under experimental assessment to measure the growth and amount of pastures across southern Australia. See the Pastures from Space website www.pasturesfromspace.csiro.au for more information
Numerous commercially available meters and probes can be found on the internet (search for "pasture + meter"). Most rural supply firms will also help locate commercially available models.
Measuring pasture height using the ruler/stick method
Use a 1cm thick dowel about 30cm in length. Draw a mark 0.5cm from the bottom, then every 1cm along the stick. Readings between 0.5cm and 1.5cm will be recorded as 1cm, readings between 1.5cm and 2.5cm as 2cm etc. Measure the height from at least 50 sites chosen at random as you cross the paddock. The best way is to throw the stick as you walk across the paddock.
To measure the pasture, place the stick vertically on the soil surface at the point where the base of the stick landed. Slide your thumb down the stick until you touch a green leaf and note the cm. Record on the record sheet.
Pasture height record sheet
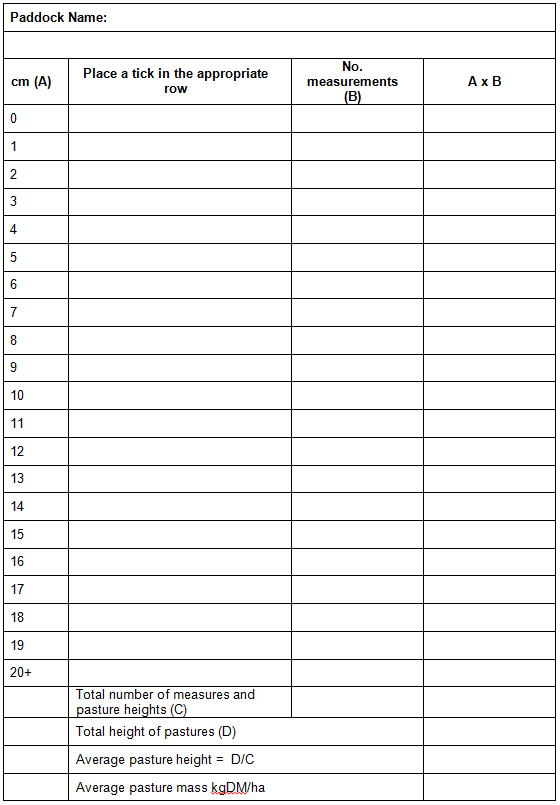
Open PDF to print the pasture height record sheet
Approximate relationship between pasture height and kg DM/ha
| Height (cm) | Lightly grazed 50% green |
Moderately grazed 100% green |
Dense 100% green |
|
1 |
250 |
400 |
500 |
|
2 |
500 |
700 |
800 |
|
3 |
600 |
1000 |
1100 |
|
4 |
800 |
1200 |
1400 |
|
5 |
1000 |
1400 |
1700 |
|
6 |
1150 |
1600 |
2000 |
|
7 |
1300 |
1700 |
2300 |
|
8 |
1450 |
1900 |
2600 |
|
9 |
1600 |
2000 |
2800 |
|
10 |
1700 |
2200 |
3000 |
Source: PROGRAZE Victoria manual, 2009
Example of completed pasture height record sheet
|
Paddock Name: Far Back |
|||
|
|
|||
|
cm (A) |
Place a tick in the appropriate row |
No. measurements (B) |
A x B |
|
0 |
|
3 |
0 |
|
1 |
|
8 |
8 |
|
2 |
|
11 |
22 |
|
3 |
|
5 |
15 |
|
4 |
|
13 |
52 |
|
5 |
|
7 |
35 |
|
6 |
|
0 |
0 |
|
7 |
|
2 |
14 |
|
8 |
|
1 |
8 |
|
9 |
|
|
|
|
10 |
|
|
|
|
11 |
|
|
|
|
12 |
|
|
|
|
13 |
|
|
|
|
14 |
|
|
|
|
15 |
|
|
|
|
16 |
|
|
|
|
17 |
|
|
|
|
18 |
|
|
|
|
19 |
|
|
|
|
20+ |
|
|
|
|
|
Total number of measures and pasture heights (C) |
50 |
|
|
|
Total height of pastures (D) |
154 |
|
|
|
Average pasture height = D/C |
154/50 = 3.08 |
|
|
|
Average pasture mass kgDM/ha |
1000 kgDM/ha |
|
Groundcover
Groundcover includes existing pasture, weeds and other herbage, as well as litter. To estimate groundcover, stand in a representative part of the pasture with your feet half a metre apart. Picture a half metre square in front of you and, looking vertically into the pasture, estimate the percentage area covered by plant matter and litter. Walk over the paddock and repeat the assessment at about 30 random sites. Record and average the results to accurately determine the percentage of groundcover. See Tool 2.2 for detailed information.
Pasture composition
There are a number of methods for measuring pasture composition. The one you choose is likely to depend on the amount of area you wish to sample and the time you have available to complete the assessments.
Outlined below are:
- PROGRAZE stick method
- Transect method
- Motorbike method
- Quadrat method
- Blundstone method.
These have been taken from Towards Sustainable Grazing – Weed Removers, Pasture Improversworkshop notes.
PROGRAZE stick method
You can use the same stick you used to assess pasture height. Drive a nail into the top of the dowel stick to allow it to measure both height and composition.
- Select transect across paddock
- Throw the stick
- Use the recording sheet provided to note the plant species touching the head of the nail
- Walk a number of steps
- Repeat the above until the paddock has been traversed
- Calculate the percentage of hits for each species/groupings.
Transect method
Similar to PROGRAZE stick method, but without the stick.
- Set and permanently mark a transect (eg paint fence posts on either side of paddock)
- Walk the transect stopping every x steps (x is determined by the length of the transect but should be sufficient to enable up to 50 points to be sampled)
- At each point, record the species touching the toe of your right boot
- Continue the process until sufficient observations have been made
- Calculate the percentage of hits for each species/groupings.
Motorbike method
For an experienced person with a trained eye, this is a rapid method of assessment that is particularly good for large paddocks.
- Ride the paddock in a uniform manner – corner to corner is a good suggestion
- Every 100m (on the odometer) or count of 20–30 seconds stop the bike and record the species that is at the toe of your boot
- Continue until 50 points have been recorded
- Calculate your composition.
Assessment sheet for the PROGRAZE Stike Transect and Motorbike methods
Open PDF to print below: Assessment sheet for the PROGRAZE Stike Transect and Motorbike methods.pdf
Quadrat method
A quadrat is a means of defining a small sample area that can be assessed.
- Place quadrat on the ground
- Stand vertically above (helicopter view) the quadrat and estimate the proportion of the quadrat area occupied by each class of species
- Record the proportions on the worksheet
- Repeat the process until sufficient sites have been sampled
- Calculate the average cover for each species.
'Blundstone' method
- Stand in the paddock with your feet about half a metre apart
- Visualise a square 0.5 × 0.5m in front of your toes
- Estimate the proportion of this square that each plant type occupies
- Take at least five random estimates from five different parts of the paddock for a reliable guide to your pasture’s composition
- Record your results on the worksheet.
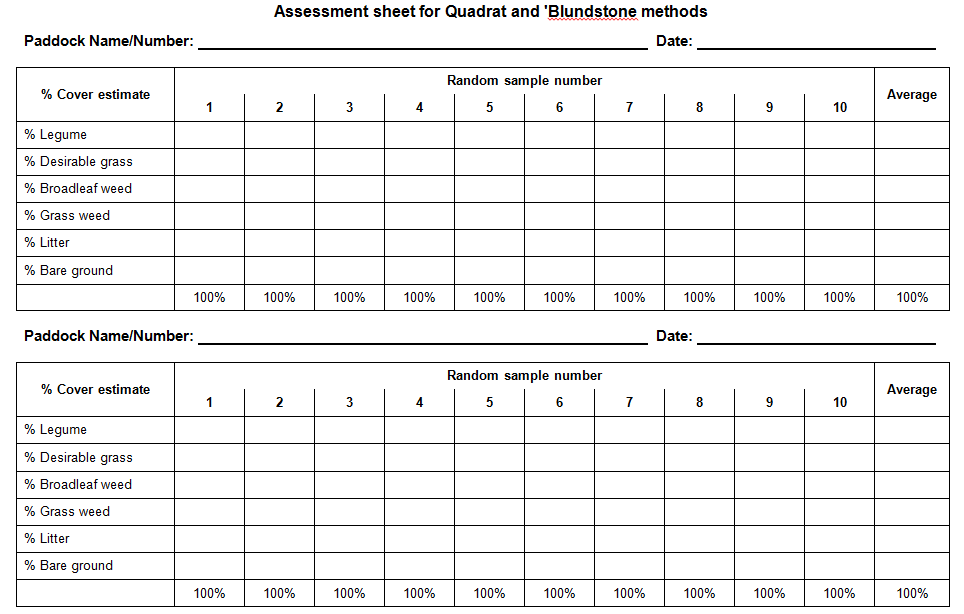
Assessment sheet for Quadrat and Blundstone methods
Open PDF to print below: Assessment sheet for Quadrat and Blundstone methods.pdf
Guidelines to composition measurements
Pasture composition – for optimum production
- Legume component in pastures as companion to introduced grass species – minimum of 20%, maximum of 30%, unless paddock is to be used specifically for high animal production (growth rates) when a higher maximum legume content may be desirable (up to 40%). Take precautions to avoid bloat in cattle when legume content is towards maximum limits.
- Legume content in native pastures – maximum of 20%.
- Productive and perennial grasses – minimum of 60%, maximum of 80%.
- Annual grass and broadleaf weeds – maximum of 10%.
- Bare ground – maximum of 10%.
- Noxious weeds – maximum of 0%.
Pasture composition – number and proportion of desirable perennial grass species
The most appropriate number and relative proportion of desirable perennial grass species within the total perennial grass component of a pasture will vary with the genetic capacity for growth and quality of each species and the objectives set for that pasture zone. The limits stated in the following table are a guide only:
- High input grass based pastures – maximum limit of two desirable grass species (difficulty of grazing management increases with number of species), with combined minimum composition of 90% of total grass component of pasture mix.
- General purpose pasture zones (native, introduced or a mix) – minimum of two desirable grass species with the dominant species a maximum of 60% of total desirable grass component.
- Special purpose pastures – limits will be defined by purpose (eg one species, such as tetraploid ryegrass, may be used in a short-term high performance pasture).
Pasture phenology
Assessment of phenology is made for target species and involves the examination of individual tillers from perennial grass clumps to count the number of new leaves on each tiller. The number of leaves is a good indicator of the start of senescence (dying) of the oldest leaf on each tiller. Generally the ideal number lies between three and four tillers; however, the number of leaves varies from species to species. Figure 1 indicates the correlation between levels of water soluble carbohydrates and leaf number for perennial ryegrass.
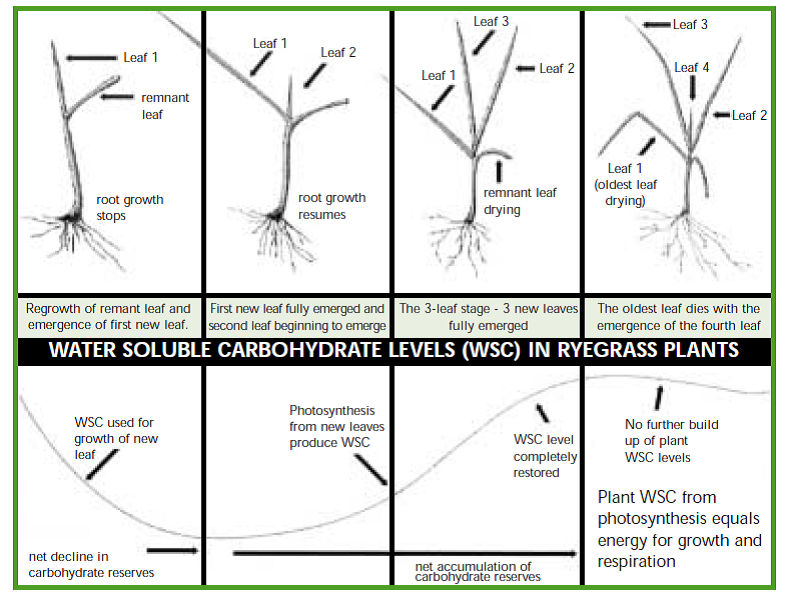
Figure 1: Regrowth of a perennial grass tiller
Module 3 Pasture utilisation contains information on the number of active growing leaves for different species, plant based grazing management methods and guidelines for monthly growth rates across the regions of southern Australia.
It is important that you can estimate pasture growth rates for your own property to better fine tune the management of your pastures.
To estimate pasture growth rate of a paddock under rotational grazing;
- Estimate herbage mass kg DM/ha as stock leave the paddock (A)
- Estimate herbage mass kg DM/ha at a point in the future (eg 30 days after stock left paddock) (B)
- Record number days between readings (eg 30 days) (days)
Calculation is: (B – A) / days = _____kg DM/ha/day
Example: Pasture height 1,200kg DM/ha when cattle left paddock. 30 days later pasture was estimated at 1,900kg DM/ha, therefore (1,900 – 1,200)/30 = 23kg DM/ha/day.
If stock are in a paddock and you need to estimate growth rate you can use the following method as described in the Pasture Management Checklist for Northern Rivers of NSW.
- Calculate the average stocking rate (DSE/ha) for the period between the two estimates of herbage mass (SR)
- Calculate the number of days in that period (T)
- Estimate the herbage mass (kgDM/ha) at the start of the period (HM1)
- Estimate the herbage mass (kgDM/ha) at the end of the period (HM2)
Calculation is: (SR xT) + (HM2 – HM1) / T = _____kgDM/ha/day
Example: 24 head of 300kg steers growing at 1kg LW/day. Steers at this weight and growth rate have a DSE rating of 10. They are grazing an area of 20ha. Therefore the average stocking arte for this area is (24 x 10)/20 = 12DSE/ha.
It has been 60 days between herbage estimates. The first herbage estimate was 1,300kg DM/ha. The second herbage estimate was 1,500kg DM/ha
So: (12 × 60) + (1500 – 1300) / 60 = 15kg DM/ha/day
Rate of run-off or surface ponding
The run-off rate is estimated by taking a full nine-litre plastic garden watering ‘can’ and, with the sprinkler top in place, steadily pouring the water evenly over a representative one metre square soil surface (soil and plant material). Finish pouring after 60 seconds. Any run-off or ponding existing at the end of this period is evidence of poor infiltration rates but will depend on the current moisture content of the soil.
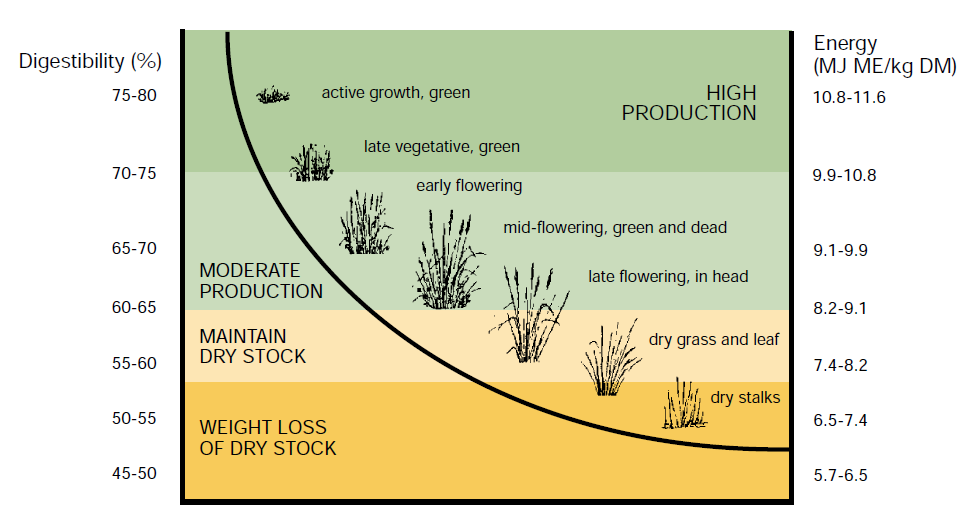
Pasture quality
Assessment of pasture quality (energy content) normally requires full laboratory analysis. Field observations provide a useful guide to energy content in MJ ME/kg DM. Actively growing green material is normally in the range of 11.0–12.0MJ ME/kg DM. Actively growing legumes normally have slightly higher energy content (+ 0.5MJ ME/kg DM) than perennial grass. Therefore pasture that is 100% green, has legume and perennial grass composition within the limits of 20–30% legume and 60–70% grass and the oldest leaf of the dominant grass has not started to senesce, can be assumed to have energy content greater than 11.5 MJ ME/kg DM. Figure 2 below gives a guide to energy decline as temperate pastures mature.